Shadow Government Stats: Why Inflation Is Higher Than You Think
MoneyMade Team · May 17, 2022 ·
Last updated

Think your savings are only losing 8% per year sitting in a bank account? Think again. Inflation may actually be in the double digits.
The Consumer Price Index (CPI) is the most common measure of inflation in the United States. After over three decades of sub 4% inflation, CPI readings exploded to 4.7% in 2021 and are currently sitting at over 8% for 2022—the highest rate we’ve seen since 1982.
If the true rate of inflation is higher than the CPI, then an investor’s real rate of return (i.e. rate of return – inflation rate) will be less than they projected.
While everyone agrees that inflation is high, some investors, economists and consumers have become skeptical of the CPI’s accuracy: Is the CPI even a good measure for inflation? Could inflation be even higher than what the CPI reports? This question is particularly pertinent for investors who want to be able to accurately measure the real returns of their investments.
Let’s pop the economy’s hood and look inside to see how inflation is measured and what the alternatives look like.
Why is the accuracy of the CPI so important to investors?
Inflation is a general increase in prices, so high inflation rates reduce the purchasing power of money. Purchasing power is represented using a price index, a weighted average of prices for a given product. Inflation, on the other hand, is commonly measured as the annualized percentage change of a price index like the Consumer Price Index (CPI).
Investors get so riled up about the CPI’s accuracy because it directly affects their performance and budgets. If the true rate of inflation is higher than the CPI, then an investor’s real rate of return (i.e. rate of return – inflation rate) will be less than they projected, assuming they’re using the CPI to measure inflation. Expected cost of living is also a key factor to consider when budgeting, so investors might find wealth management more challenging when they can’t accurately measure inflation.
What’s more, gross domestic product (GDP) is an important measure for gauging the overall strength of the economy, and the CPI and GDP have an inverse relationship. So if CPI figures are lower than the reality of inflation, investors may falsely believe that an economy is stronger than it really is.
What is CPI and how is it calculated?
The Consumer Price Index (CPI), as reported by the U.S. Bureau of Labor Statistics (BLS), measures the average price change for a market basket of consumer goods and services in the United States. And although the CPI’s methodology is not fully transparent, the BLS website does give us a high-level overview of the process.
Item selection
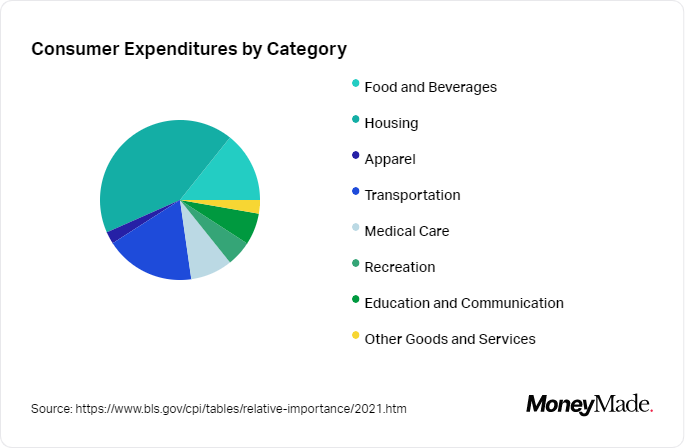
To decide on a basket of goods, the BLS surveys about 7,000 households on their spending habits via the Consumer Expenditure Survey. These expenditures are divided into eight weighted categories, which in turn consist of over 200 item sub-categories. As you can see, housing is the largest category by far (at over 40% of the index).
Data collection
To collect prices, economic assistants visit or call about 23,000 stores in 87 urban areas all over the United States and survey 50,000 landlords or tenants. For each individual item in the index (e.g. cereal), the BLS samples hundreds of instances of that item (e.g. 14.7 oz box of Fruit Loops vs 21.1 oz box of Captain Crunch) to assess price changes.
Index calculation
BLS ultimately combines the prices of individual products multiplied by their corresponding weights in the market basket. CPI also allows for changes like product substitution and quality improvements.
Criticisms of the CPI
Everyone has their own opinion of how inflation should be measured, and each separate measure produces different rates of inflation for the same period. The CPI has faced its fair share of criticisms stating it might not be the most accurate way to measure inflation.
Methodological changes over the years have been a cause for concern to some. Prior to 1995, The CPI was criticized for having an upward bias (overstating inflation) because it omitted consumer substitution of products, among other things. But after the BLS introduced some methodological changes based on the Boskin Report, some started to claim the CPI had a downward bias (understating inflation). While this new methodology allows for changes in the basket based on quality of goods and substitution, these changes could also be a way to selectively exclude certain products that worsen the inflation numbers. The methodological changes have also made it difficult for analysts to compare current CPI data to that of earlier periods.
In addition to these changes, issues with transparency and lagging data have also been pointed out as flaws with the CPI system. The raw data used to calculate the CPI is not publically available, so outsiders can’t audit their work. The BLS updates the weights of individual goods and services inside the market basket every two years, and that rate of adaptation is just too slow to reflect our rapidly changing world. In a black swan event like the COVID-19 pandemic, for instance, the importance of food far outweighed that of transportation. Still, transportation was weighted at 18% while food had a weight of 14%.
Alternate measures of inflation
Investors have two major options when it comes to measuring inflation. On the one hand, they could accept the government-reported CPI figures at face value. Alternatively, they could rely on some other measures of inflation, like the PPI, the GDP index, the PCE.
PPI
The Producer Price Index (PPI) measures the domestic output of raw goods and services.
Key details:
- Latest figure: 11.0% (as of April 2022)
- Frequency: Monthly
- Value: Accounts for the fact that producers pass their production costs on to retailers and consumers.
- Main weakness: Could be used as a proxy for consumer inflation, but does not account for consumer demand.
GDP Index
The gross domestic product price index (GDP Index) measures changes in the prices of goods and services produced in the United States.
Key details:
- Latest figure: 8% (as of Q1, 2022)
- Frequency: Quarterly
- Value: Includes prices for more items and thus seems less biased than the CPI.
- Main weaknesses: Includes very hard-to-measure prices, like that of factory purchases. Prices of imports are excluded from this measure.
PCE
Measures price changes in consumer goods and services exchanged in the U.S. economy.
Key details:
- Latest figure: 6.6 % (as of March 2022)
- Frequency: Monthly
- Value: Measures a wider range of consumer expenses. Uses data from business surveys rather than consumer surveys. Accounts for short-term changes in consumer behavior.
- Main weakness: Some academics don’t trust the initial readings that the index is based on (too math-y to us to get into), so that casts doubt on subsequent readings. Survey data can be unreliable.
Original CPI
John Williams, an American economic blogger, prefers an inflation measure calculated using the original CPI methodology based on a fixed basket of goods. But why a fixed basket?
Since the current CPI methodology allows for changes in the market basket based on product substitution, Williams feels that more weight is often given to goods whose prices increase the least and less weight to goods whose prices increase the most.
Here’s a peek at what the original basket looked like in 1982-84.
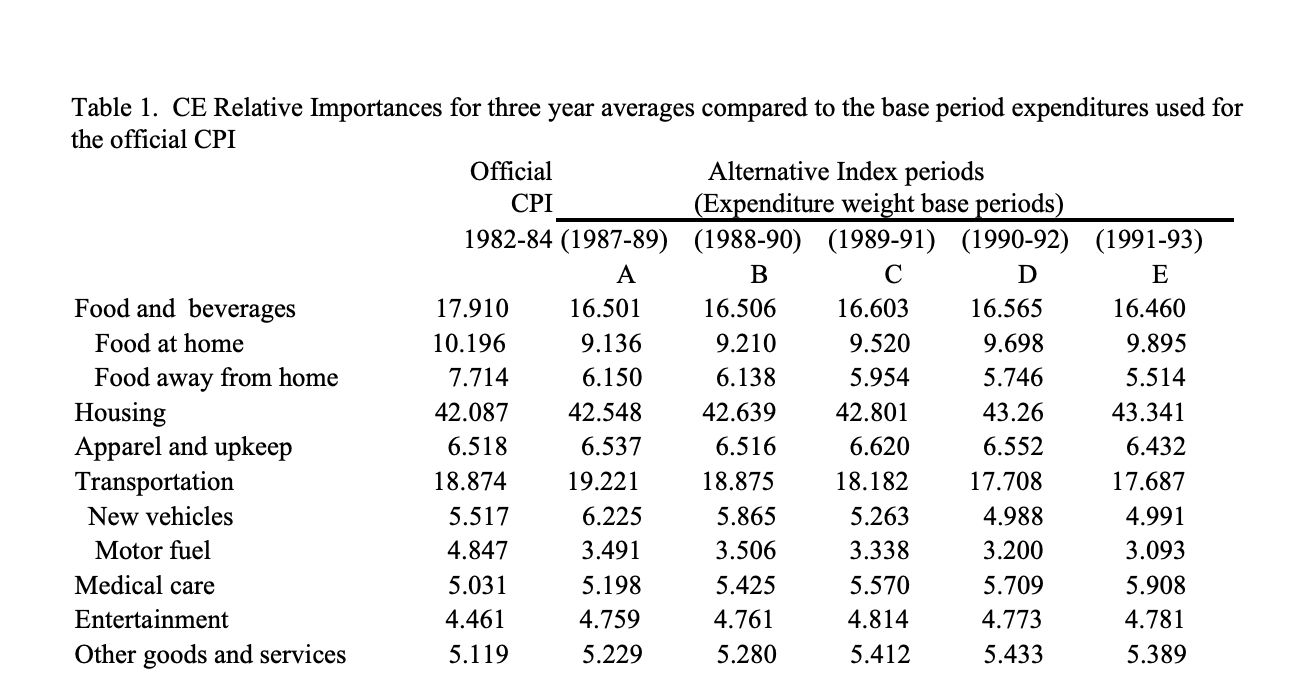
Source: bls.gov
Now according to Williams’ site Shadow Government Statistics, the April 2022 inflation rate came in at jaw-dropping 16.5% as per the original CPI. Absolute madness, right? That being said, professional economists like Ed Dolan ultimately disagree with the extent to which Williams believes that the current CPI understates inflation. So you should definitely do your own research to pick a side on that issue.
As a more comprehensive solution to measuring U.S. inflation, investors can reference the Producer Price Index (PPI), gross domestic product (GDP) index and original CPI side by side with the Consumer Price Index (CPI). If you take an average of all of the latest figures from each calculation method described above, inflation comes in at over 10% (more than 2% above CPI).
Top Investing Platforms for stocks
Fundrise
Real Estate
Min $104.8/5Learn more →Arrived
Real Estate
Min $1004.5/5Learn more →Ark7
Real Estate
Min $204.3/5Learn more →