What Is Tokenomics? How to Analyze Blockchain Projects
MoneyMade Team · June 16, 2022 ·
Last updated
Is your favorite altcoin going to the moon, or plummeting to $0 like LUNA? Here’s how tokenomics can help you separate the gems from the shitcoins.
During bear markets, crypto Twitter is chock-full of retail investors posting WAGMI (We’re All Gonna Make It).
But are we all really going to make our fortune in this digital gold rush? What separates the few who make it from the majority who get rekt? Well for one, smart money investors have an intimate understanding of tokenomics.
But what does that term mean, exactly? Let’s go over what tokenomics is and everything you need to consider when you’re evaluating the potential of any given crypto project.
What is tokenomics?
Just like companies issue stock you can buy to become a shareholder, crypto projects issue tokens that represent ownership in their protocols and ecosystems.
Tokenomics (a portmanteau of “token” and “economics”) refers to the supply and demand forces that affect a token’s long-term value. This includes everything from the production, distribution and usage of a token to the destruction of its supply.
…inexperienced investors tend to only look at the total amount of tokens a project has. But that’s not the main question you should be asking.
So why is it important to understand tokenomics? Because well-designed tokenomics incentivizes investors to HODL a token to the moon. And as demand for a token increases while supply goes down, price has nowhere to go but up. In contrast to good token design, poor tokenomics places a lot of sell-pressure on a token and ultimately causes the price to crash.
Now, let’s take a closer look at the major factors on each side of a token’s market.
The supply-side of tokenomics
When it comes to supply, inexperienced investors tend to only look at the total amount of tokens a project has. But that’s not the main question you should be asking. Instead, you should be asking this: How many tokens exist right now, and how many will there be in the future? And when will the rest of these tokens be released? To answer that, we’ll have to familiarize ourselves with a few terms and metrics.
Circulating, total, and max supply
- Circulating supply: how many tokens exists right now
- Maximum supply: the most tokens that can ever exist
- Total supply: maximum supply minus burned supply
As a grade school example of these metrics in action, Bitcoin’s circulating supply is relatively low, with a supply cap of 21 million. Dogecoin, on the other hand, has a far higher circulating supply with no cap in sight, making it substantially inflationary.
Valuation metrics
- Market cap: price times circulating supply
- Fully diluted valuation (FDV): price times max supply
- Total value locked: total funds deposited into DeFi protocols
- Mcap/TVL: market cap divided by total value locked
The next step along our analysis is to evaluate whether a project is under or overvalued compared to projects or businesses of similar size. For this, you can use a tool like Marketcapof.com to show the price of Asset A with the market cap of Asset B (e.g. API3 and Chainlink).
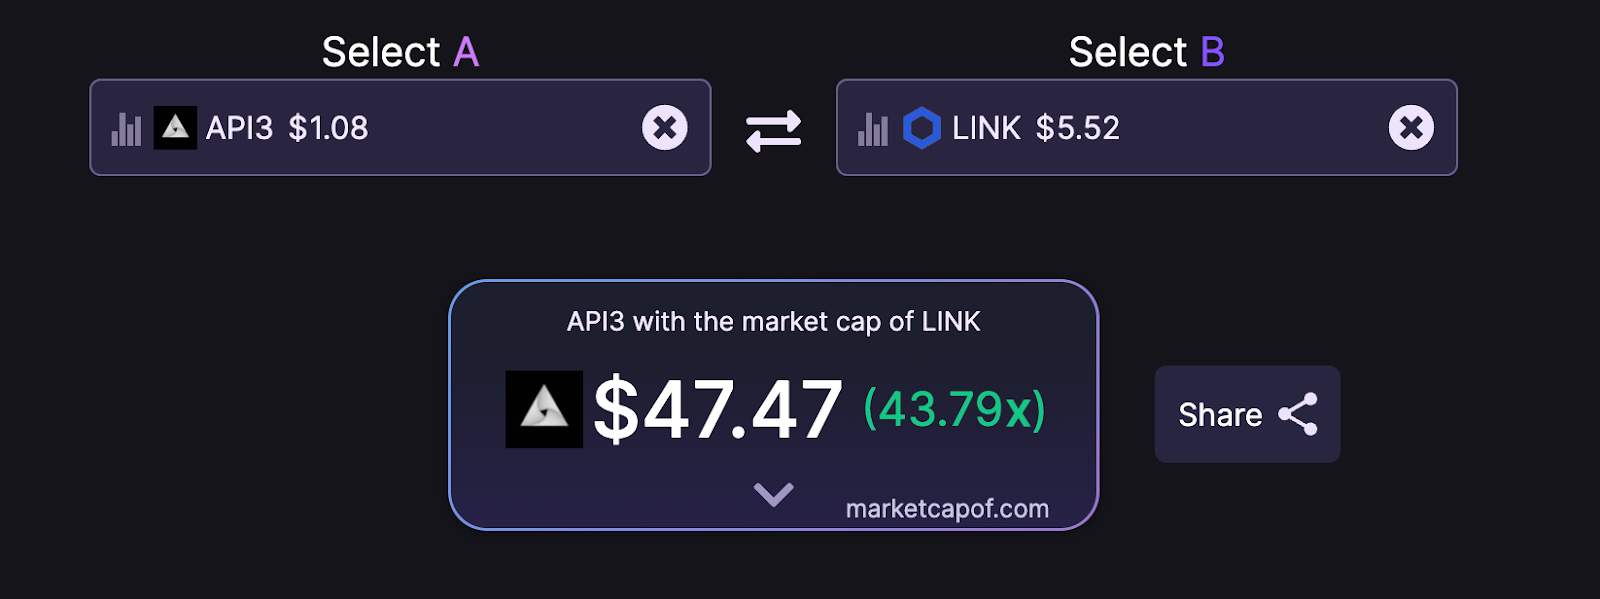
Source: Marketcapof
Mcap/TVL, on the other hand, is a metric similar to the traditional price-to-earnings ratio that allows you to compare Layer 1s by their ecosystem size. Looking at VeChain, an enterprise Layer 1 blockchain, its crypto token (VET) has only about $5 million in TVL but a market cap of $1.97 billion, giving it a Mcap/TVL ratio of 380 as of June 2022.
This is currently amongst the highest Mcap/TVL ratios across all Layer 1 blockchains. For context, Ethereum currently has a Mcap/TVL ratio of 2.70. In other words, this could indicate that VET is overvalued.
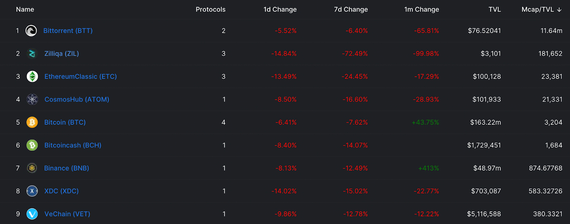
Top 9 blockchains with the highest Mcap/TVL ratios as of June 2022
Source: defillama.com
FDV is another metric for evaluating overvaluation and potential sell pressure. Avalanche (AVAX), for instance, has a market cap of $5.25 billion and a FDV of $13.46 billion as of June 2022. This huge gap indicates that there’s a literal avalanche of tokens that have yet to be released onto the market.
In some cases, this could mean a severe devaluation in the future. However, in this case it’s not a major red flag, since the supply curve pictured below in combination with Coinmarketcap show that it’s going to take about 4 years for the remaining 61% of max supply to be released. See the importance of paying attention to a token’s current market cap versus its FDV?
$AVAX liquid supply curve
Source: messari.io
Allocation
A project can allocate its tokens as follows:
- Core team: reserved for founders plus current and future employees
- Private investors: allocated to angel investors and venture capitalists
- Public sale: sold to the general public in an ICO
- Treasury: retained for funding the project and community initiatives, sometimes through DAO governance
- Airdrop: tokens gifted to early users
- Ecosystem incentives: motivate users to engage with the ecosystem (e.g. through yield farming)
What, exactly, constitutes “good” token allocation? This is subjective. But overall, the higher the percentage allocated to the community, the better. The danger behind higher insider allocation (30%+) is that investors can crash the token’s price when they cash out.
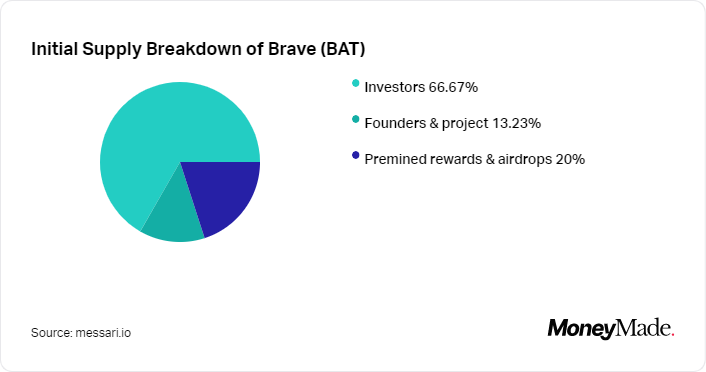
If we take a look at the Brave (BAT) token distribution from 2017, we can see that over 66% was allocated to investors, while a measly 20% was allocated to the community. Tsk, tsk.
Fast forward a few years, and Etherscan shows that BAT has over 452K holders as of June 2022. More than 25% of its supply is now being held on the Compound protocol and various exchanges (Binance, Kraken, Bittrex, Gemini). There’s also one unlabeled wallet holding over 9%. This example shows how even heavily centralized projects can become more decentralized over time, and that it’s worth reevaluating a token’s allocation after a few years to see if the numbers have become more in line with your preferences.
Emissions
- Inflation: token issuance that increases the circulating supply
- Deflation: when more tokens are taken out of circulation than issued
- Vesting: unlocking an early investor’s purchased tokens in phases
- Cliff: the amount of time before the first tranche of vested tokens are unlocked
Emissions tell us two things: how and when all tokens will be released. Cardano ($ADA), for instance, has a fixed inflation rate of 1.96%. And the graph below shows us that Cardano’s team and investor allocations have already unlocked. So from here on out, the circulating supply only increases through staking rewards.
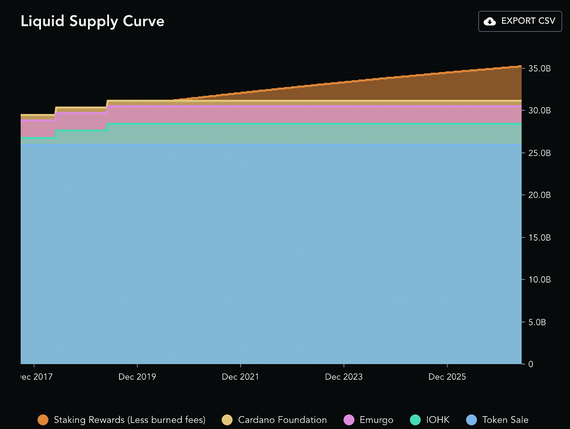
Cardano liquid supply curve
Source: messari.io
Meanwhile, the BitTorrent token (BTT) has a circulating supply of 932 trillion as of June 2022 with no cap. At one point its inflation rate was even quoted at a jaw dropping 70.98%. Sear this into your memory: the higher the inflation rate, the faster a token’s price will trend downwards.
On the flip side of inflation, we have deflation. With the upcoming Ethereum merge, the Ethereum token (ETH) will be the most notable example of a deflationary token. While $ETH currently issues about $30 million of daily supply, post-merge insurance will decline to about $5 million per day. Remember: Prices go parabolic when there’s less supply at constant or higher demand.
Finally, let’s look at vesting schedules. The thing to watch out for here is how many tokens are going to be released on a given date and who they belong to. Early investors are massively incentivized to take profits if the bulk of their tokens are unlocked all at once. You might not want to be left holding the bag when that happens.
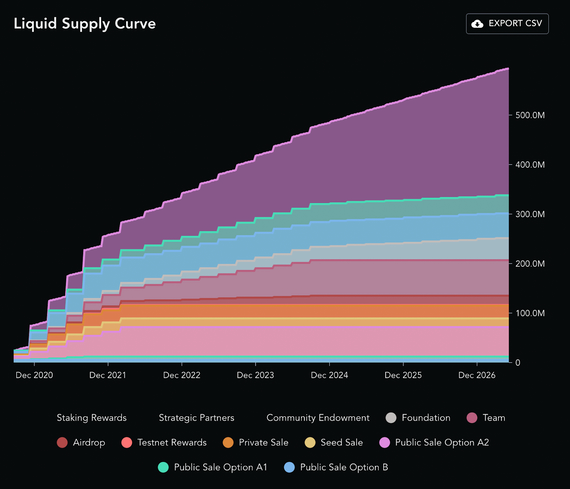
As you can see from the NEAR Protocol vesting schedule below, Series A tokens begin unlocking in December 2020, and these emissions gradually ramp up until 2026.
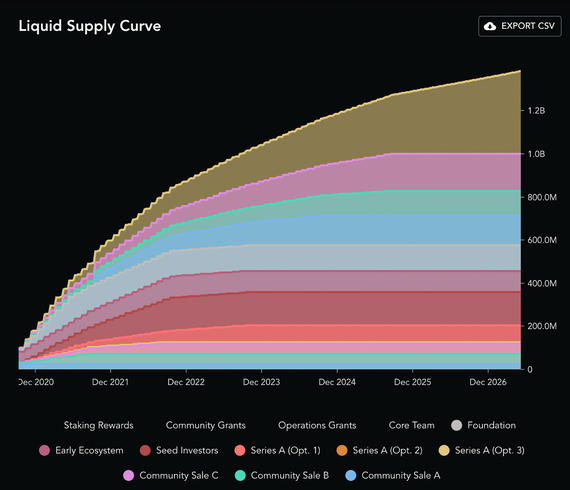
NEAR Protocol liquid supply curve
Source: messari.io
The demand-side of tokenomics
Analyzing tokenomics has been pretty data-driven thus far, am I right?. But estimating demand is more an art than a science since you’re analyzing sentiment more than the underlying technology. In other words, you’ll want to dig into Twitter and Discord communities rather than blockchain documents and white papers. The need to account for memes is a prime example of this.
Memes & narrative
Memes and narratives have power because community members believe a token will have value in the future and will do their best to convince others of this.
Do not underestimate how far projects can get by simply tapping into emotions and uniting people for a cause—even with little to no real world adoption. Examples of strong narratives include:
- BTC: store of value to rival gold
- ETH (post-merge): ESG-compliant, commodity-linked bond
- Cardano: research-focused blockchain aiming to increase financial inclusion
- Solana: the fastest and cheapest alternative to Ethereum
Game theory
In the blockchain space, game theory refers to the way protocols incentivize users to engage with the network or hold the token.
For instance, Layer 1 blockchains want validators or miners to secure their network. In exchange for this service, they offer block rewards. Polkadot (DOT), for instance, offers a 14.69% APY for validator nodes as of June 2022. Some blockchains also use game theory to disincentivize bad behavior, like how DOT attackers can currently lose up to 7% of their stake through slashing.
Utility
The final demand-side factor to take into account is: Why would anyone want to hold this token? Token utility could mean anything from using your tokens to vote on governance proposals or depositing your tokens as collateral to borrow against. But the most common form of utility is value accrual, i.e. the way that a protocol spreads wealth within the community.
Value accrual comes in a variety of forms like:
- Discounts on trading fees, e.g. FTX Token (FTT)
- Staking rewards, e.g. Polygon (MATIC)’s current 7.74% APY
- Revenue sharing, e.g. Uniswap LP tokens
- Burning a % of supply, e.g. BNB
This cannot be stressed enough: When it comes to staking rewards, you need to do your research on where the money’s coming from—or risk falling victim to Ponzinomics.
The late Anchor Protocol, for instance, promised users a 20% APR. But after the UST algorithmic stablecoin collapsed, countless investors lost their life savings because they failed to question the sustainability of Anchor’s advertised yield.
Now, if you feel like your head is going to explode trying to memorize all of these tokenomic tips, don’t worry. Here’s a checklist you can use to evaluate the attractiveness of any project’s tokenomics.
The Parabolic Tokenomics Checklist:
 Has a maximum (and ideally sub-1B) supply Has a maximum (and ideally sub-1B) supply |
| A majority of the maximum supply is already in circulation |
| Isn’t overvalued according to their ecosystem size |
| Has a fixed, single-digit (ideally sub-5%) inflation rate with the ability to become deflationary |
| Allocated about 40-50% (or more) of tokens to the community |
| Implemented multi-year lock-ups for insiders |
| Has a strong narrative backing it |
| Enables community governance through a DAO |
| Generates yield through sustainable revenue sources |
| Burns a portion of supply to make existing tokens more valuable |
Top Investing Platforms for crypto
Fundrise
Real Estate
Min $104.8/5Learn more →Arrived
Real Estate
Min $1004.5/5Learn more →Ark7
Real Estate
Min $204.3/5Learn more →